# my global config global: scrape_interval:15s# Set the scrape interval to every 15 seconds. Default is every 1 minute. evaluation_interval:15s# Evaluate rules every 15 seconds. The default is every 1 minute. # scrape_timeout is set to the global default (10s).
# Load rules once and periodically evaluate them according to the global 'evaluation_interval'. rule_files: # - "first_rules.yml" # - "second_rules.yml"
# A scrape configuration containing exactly one endpoint to scrape: # Here it's Prometheus itself. scrape_configs: # The job name is added as a label `job=<job_name>` to any timeseries scraped from this config. -job_name:"prometheus"
# metrics_path defaults to '/metrics' # scheme defaults to 'http'.
static_configs: -targets: ["localhost:9090"]
运行以下命令启动Prometheus:
1
./prometheus
or
1
./prometheus --config.file=prometheus.yml
控制台会打印出一些日志
1
2
3
4
5
6
7
8
ts=2022-06-01T06:23:12.752Z caller=main.go:488 level=info msg="No time or size retention was set so using the default time retention" duration=15d
ts=2022-06-01T06:23:12.752Z caller=main.go:525 level=info msg="Starting Prometheus" version="(version=2.35.0, branch=HEAD, revision=6656cd29fe6ac92bab91ecec0fe162ef0f187654)"
ts=2022-06-01T06:23:12.752Z caller=main.go:530 level=info build_context="(go=go1.18.1, user=root@cf6852b14d68, date=20220421-09:53:42)"
ts=2022-06-01T06:23:12.752Z caller=main.go:531 level=info host_details="(Linux 5.4.0-1078-azure #81~18.04.1-Ubuntu SMP Mon Apr 25 23:16:13 UTC 2022 x86_64 TitanTest02 (none))"
ts=2022-06-01T06:23:12.752Z caller=main.go:532 level=info fd_limits="(soft=1024, hard=1048576)"
ts=2022-06-01T06:23:12.752Z caller=main.go:533 level=info vm_limits="(soft=unlimited, hard=unlimited)"
ts=2022-06-01T06:23:12.754Z caller=web.go:541 level=info component=web msg="Start listening for connections" address=0.0.0.0:9090
ts=2022-06-01T06:23:12.755Z caller=main.go:957 level=info msg="Starting TSDB ..."
global: # Subtracted from Prometheus' scrape_timeout to give us some headroom and prevent Prometheus from timing out first. scrape_timeout_offset:500ms # Minimum interval between collector runs: by default (0s) collectors are executed on every scrape. min_interval:0s # Maximum number of open connections to any one target. Metric queries will run concurrently on multiple connections, # as will concurrent scrapes. max_connections:3 # Maximum number of idle connections to any one target. Unless you use very long collection intervals, this should # always be the same as max_connections. max_idle_connections:3
# A SQL Exporter job is the equivalent of a Prometheus job: a set of related DB instances. jobs:
# All metrics for the targets defined here get a `job="pricing_db"` label. -job_name:mssql_standard
# Collectors (referenced by name) to execute on all targets in this job. collectors: [mssql_standard]
# Similar to Prometheus static_configs. static_configs: -targets: # Map of instance name (exported as instance label) to DSN 'data.database.windows.net:1433':'sqlserver://username:[email protected]:1433' 'data.database.windows.net:1433':'sqlserver://username:[email protected]:1433' labels: env:'prod' -targets: # Map of instance name (exported as instance label) to DSN 'data.database.windows.net:1433':'sqlserver://username:[email protected]:1433' labels: env:'test'
# A collector defining standard metrics for Microsoft SQL Server. # # It is required that the SQL Server user has the following permissions: # # GRANT VIEW ANY DEFINITION TO # GRANT VIEW SERVER STATE TO # collector_name:mssql_standard
# Similar to global.min_interval, but applies to the queries defined by this collector only. #min_interval: 0s
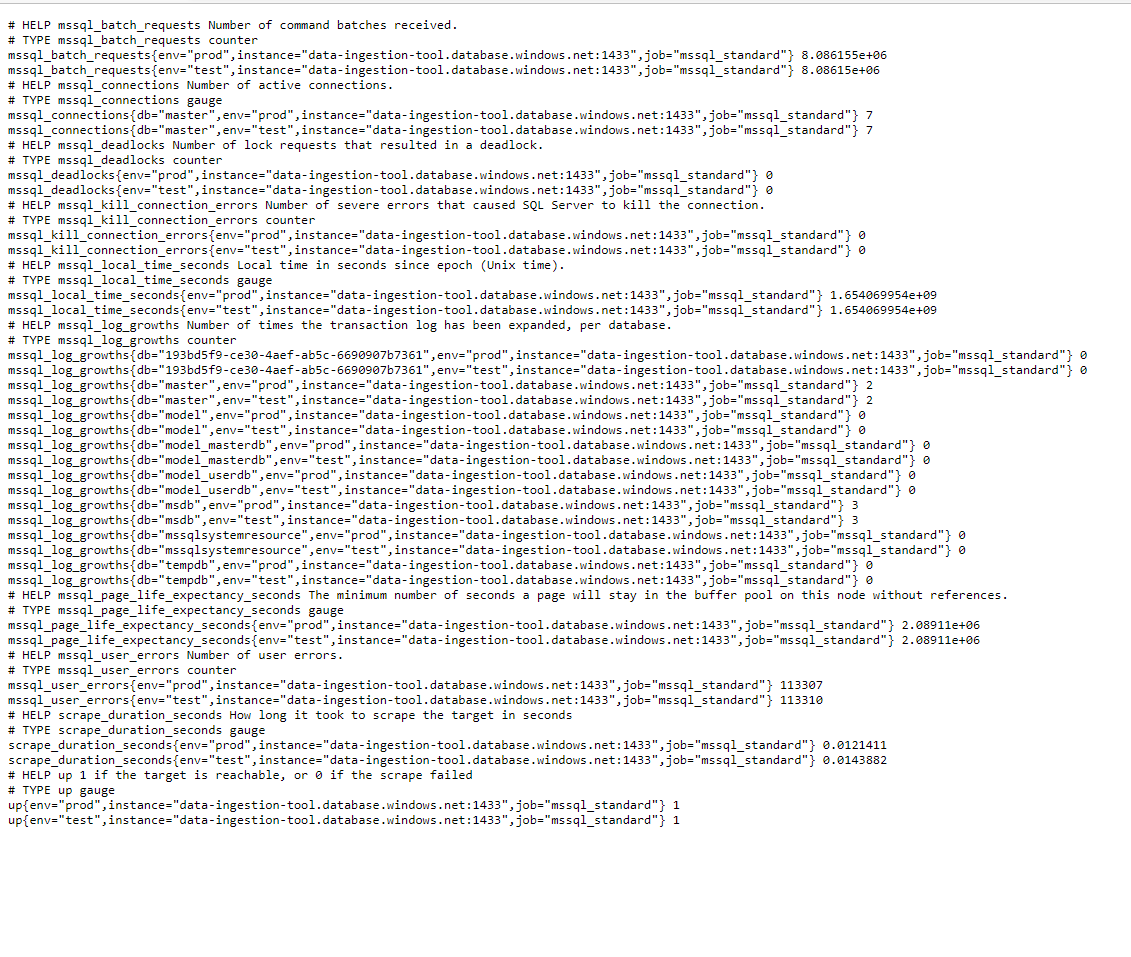
metrics: -metric_name:mssql_local_time_seconds type:gauge help:'Local time in seconds since epoch (Unix time).' values: [unix_time] query:| SELECT DATEDIFF(second, '19700101', GETUTCDATE()) AS unix_time -metric_name:mssql_connections type:gauge help:'Number of active connections.' key_labels: -db values: [count] query:| SELECT DB_NAME(sp.dbid) AS db, COUNT(sp.spid) AS count FROM sys.sysprocesses sp GROUP BY DB_NAME(sp.dbid) # # Collected from sys.dm_os_performance_counters # -metric_name:mssql_deadlocks type:counter help:'Number of lock requests that resulted in a deadlock.' values: [cntr_value] query:| SELECT cntr_value FROM sys.dm_os_performance_counters WITH (NOLOCK) WHERE counter_name = 'Number of Deadlocks/sec' AND instance_name = '_Total' -metric_name:mssql_user_errors type:counter help:'Number of user errors.' values: [cntr_value] query:| SELECT cntr_value FROM sys.dm_os_performance_counters WITH (NOLOCK) WHERE counter_name = 'Errors/sec' AND instance_name = 'User Errors' -metric_name:mssql_kill_connection_errors type:counter help:'Number of severe errors that caused SQL Server to kill the connection.' values: [cntr_value] query:| SELECT cntr_value FROM sys.dm_os_performance_counters WITH (NOLOCK) WHERE counter_name = 'Errors/sec' AND instance_name = 'Kill Connection Errors' -metric_name:mssql_page_life_expectancy_seconds type:gauge help:'The minimum number of seconds a page will stay in the buffer pool on this node without references.' values: [cntr_value] query:| SELECT top(1) cntr_value FROM sys.dm_os_performance_counters WITH (NOLOCK) WHERE counter_name = 'Page life expectancy' -metric_name:mssql_batch_requests type:counter help:'Number of command batches received.' values: [cntr_value] query:| SELECT cntr_value FROM sys.dm_os_performance_counters WITH (NOLOCK) WHERE counter_name = 'Batch Requests/sec' -metric_name:mssql_log_growths type:counter help:'Number of times the transaction log has been expanded, per database.' key_labels: -db values: [cntr_value] query:| SELECT rtrim(instance_name) AS db, cntr_value FROM sys.dm_os_performance_counters WITH (NOLOCK) WHERE counter_name = 'Log Growths' AND instance_name <> '_Total' # # Collected from sys.dm_io_virtual_file_stats # -metric_name:mssql_io_stall_seconds type:counter help:'Stall time in seconds per database and I/O operation.' key_labels: -db value_label:operation values: -read -write query_ref:mssql_io_stall -metric_name:mssql_io_stall_total_seconds type:counter help:'Total stall time in seconds per database.' key_labels: -db values: -io_stall query_ref:mssql_io_stall
# # Collected from sys.dm_os_process_memory # -metric_name:mssql_resident_memory_bytes type:gauge help:'SQL Server resident memory size (AKA working set).' values: [resident_memory_bytes] query_ref:mssql_process_memory
-metric_name:mssql_memory_utilization_percentage type:gauge help:'The percentage of committed memory that is in the working set.' values: [memory_utilization_percentage] query_ref:mssql_process_memory
-metric_name:mssql_page_fault_count type:counter help:'The number of page faults that were incurred by the SQL Server process.' values: [page_fault_count] query_ref:mssql_process_memory
# # Collected from sys.dm_os_sys_memory # -metric_name:mssql_os_memory type:gauge help:'OS physical memory, used and available.' value_label:'state' values: [used, available] query:| SELECT (total_physical_memory_kb - available_physical_memory_kb) * 1024 AS used, available_physical_memory_kb * 1024 AS available FROM sys.dm_os_sys_memory -metric_name:mssql_os_page_file type:gauge help:'OS page file, used and available.' value_label:'state' values: [used, available] query:| SELECT (total_page_file_kb - available_page_file_kb) * 1024 AS used, available_page_file_kb * 1024 AS available FROM sys.dm_os_sys_memory queries: # Populates `mssql_io_stall` and `mssql_io_stall_total` -query_name:mssql_io_stall query:| SELECT cast(DB_Name(a.database_id) as varchar) AS [db], sum(io_stall_read_ms) / 1000.0 AS [read], sum(io_stall_write_ms) / 1000.0 AS [write], sum(io_stall) / 1000.0 AS io_stall FROM sys.dm_io_virtual_file_stats(null, null) a INNER JOIN sys.master_files b ON a.database_id = b.database_id AND a.file_id = b.file_id GROUP BY a.database_id # Populates `mssql_resident_memory_bytes`, `mssql_virtual_memory_bytes`, `mssql_memory_utilization_percentage` and # `mssql_page_fault_count`. -query_name:mssql_process_memory query:| SELECT physical_memory_in_use_kb * 1024 AS resident_memory_bytes, virtual_address_space_committed_kb * 1024 AS virtual_memory_bytes, memory_utilization_percentage, page_fault_count FROM sys.dm_os_process_memory